Using the Employee Engagement Dashboard
As part of the HR module, you are provided with an Out-Of-The-Box Employee Engagement Dashboard. This allows the HR team to quickly see the engagement and loyalty of staff by department based on the eNPS Score. (See Employee Engagement Process for a breakdown of the eNPS score and what it means).
Accessing the Employee Engagement Dashboard
- Navigate to Human Resources > HR Reporting
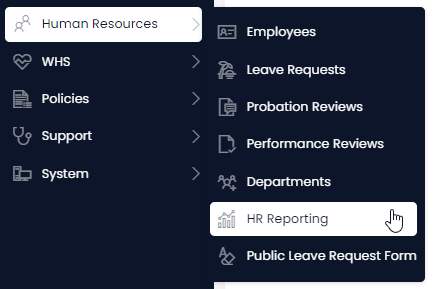
- Select the Employee Engagement tab

Using the Employee Engagement Dashboard
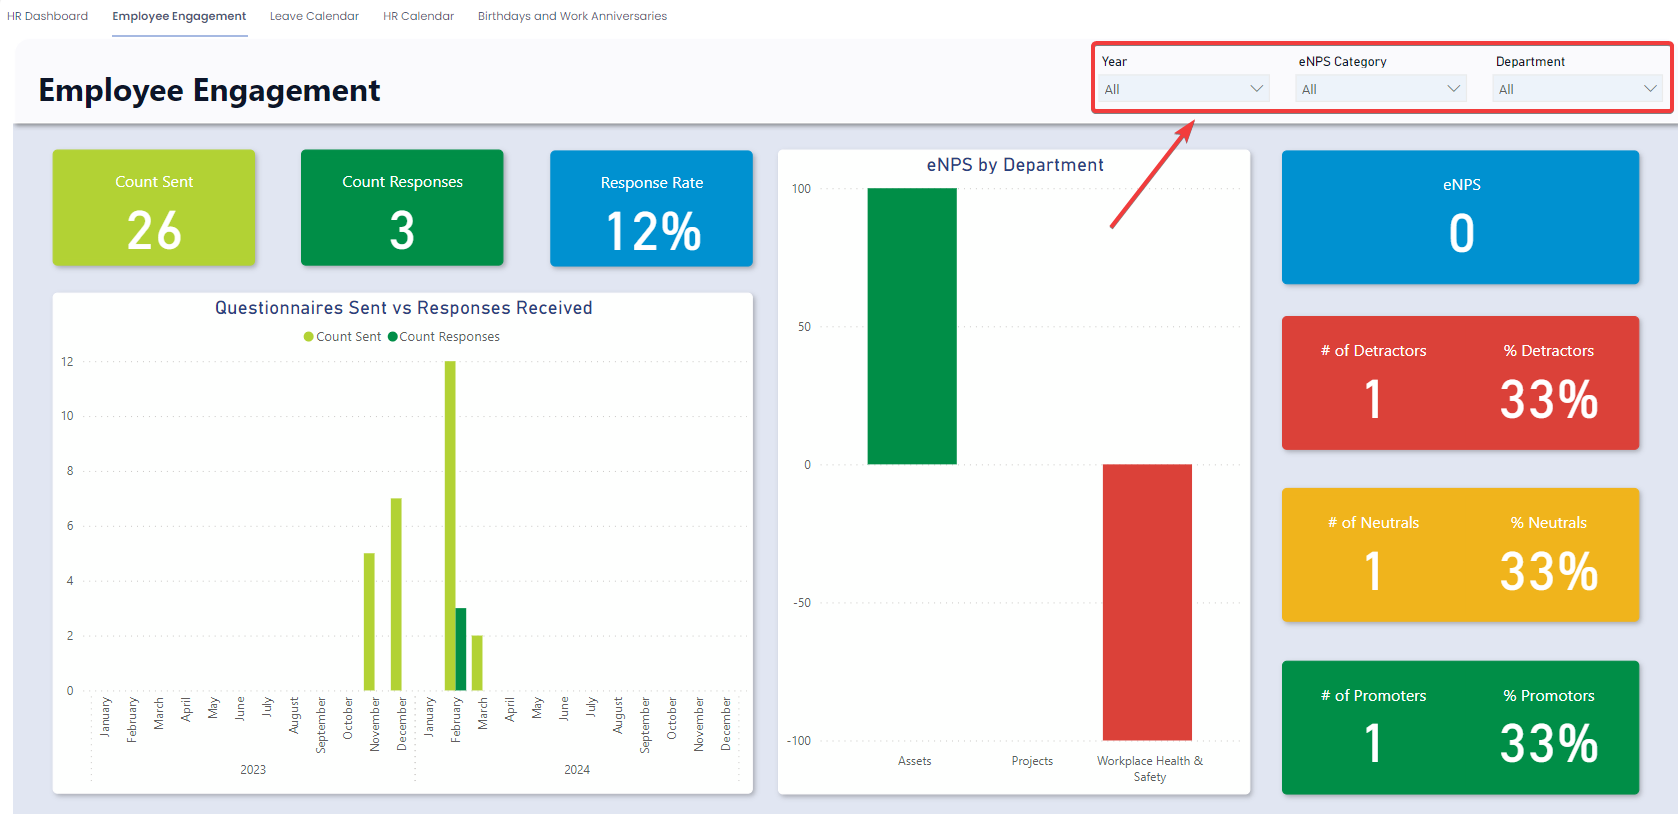
Slicers
Slicers provides the user with the ability to filter all of the visuals on the page by a specific attribute. They can be found at the top of the page.
The Employee Engagement Report can be “sliced” based on no attributes, one attribute, or multiple attributes. The attributes available to “slice” by are Year, eNPS Category, and Department.
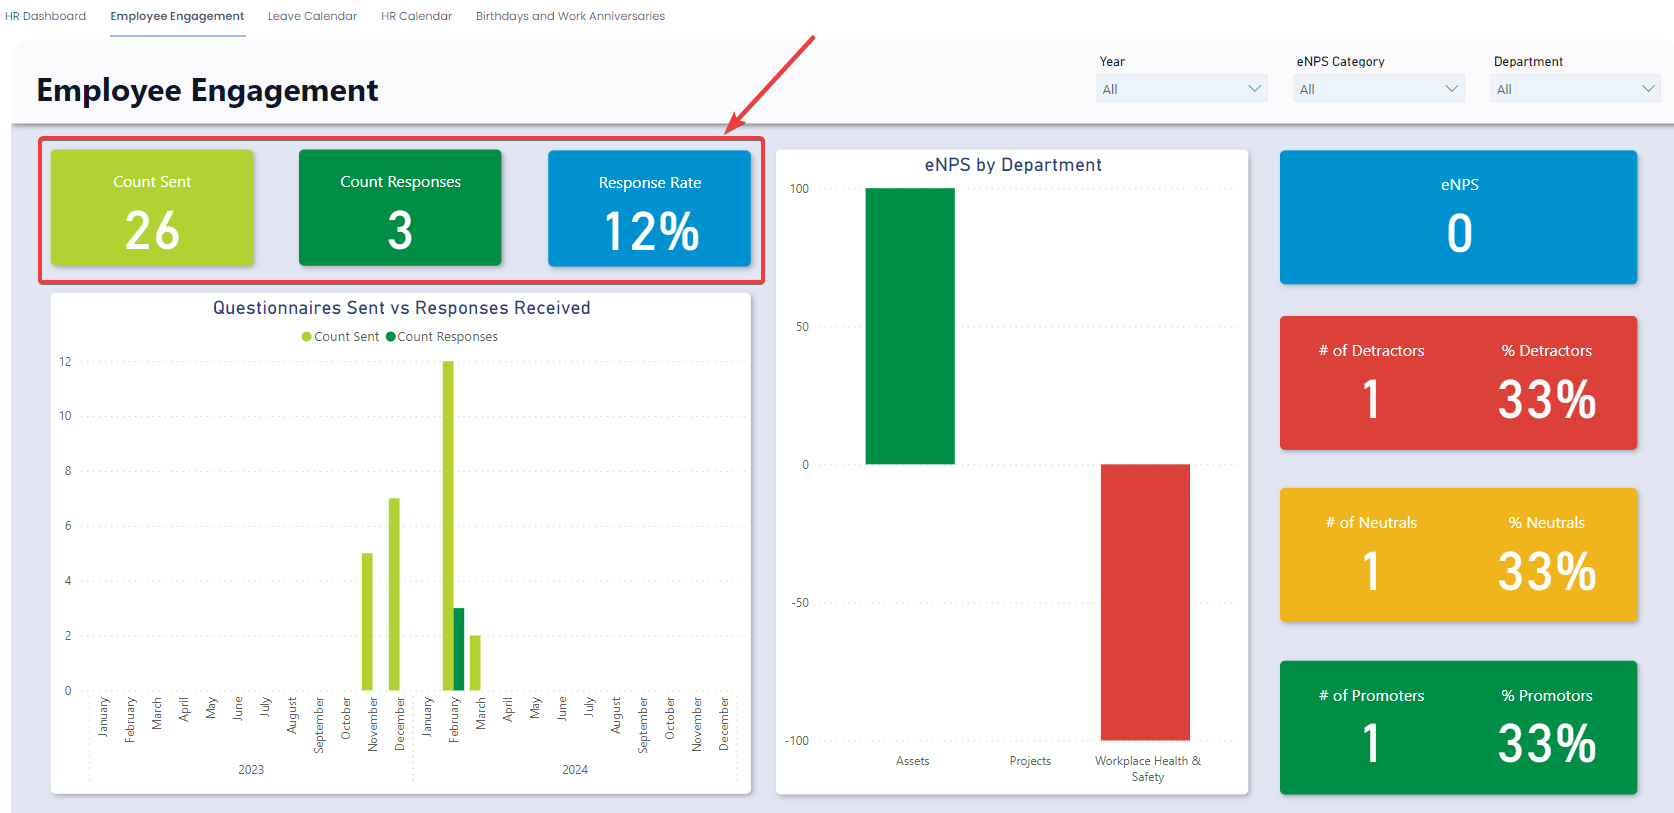
Cards
The Cards section within the Questionnaires Sent and Responses Received section offers concise reference statistics. The values of these cards will change based on the slicers.
The provided cards are as follows:
- Count Sent – Indicates the number of Employee Engagement Questionnaires sent. (This can be sliced by Year).
- Count Responses – Represents the count of the responses received (Can be sliced by Year, and Department).
- Response Rate – The percentage of responses based on the count sent.
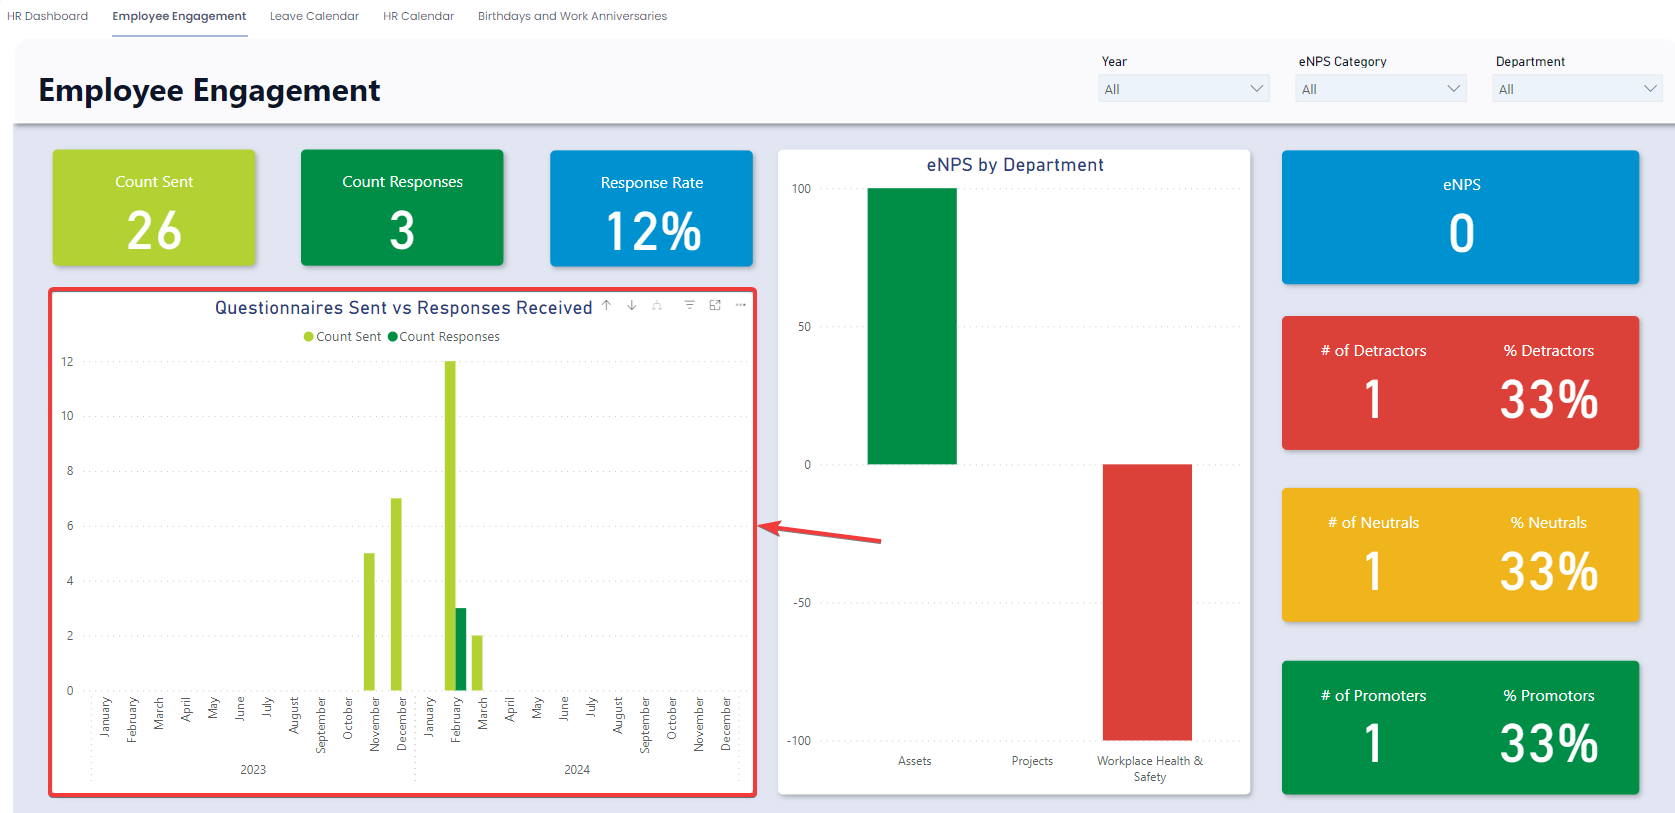
Questionnaires Sent vs Responses Received Graph
The Questionnaires Sent vs Responses Received graph is a simple visual that shows the number of questionnaires sent and the number of responses received through time at a month level.
It is also possible to change the unit of time from “Month” to “Year”. To do this simply click on the “Drill Up” arrow on the top right of the visual. To move back from the “Year” view to the “Month” view click on the “Drill Down” button and select the year you wish to drill down to.
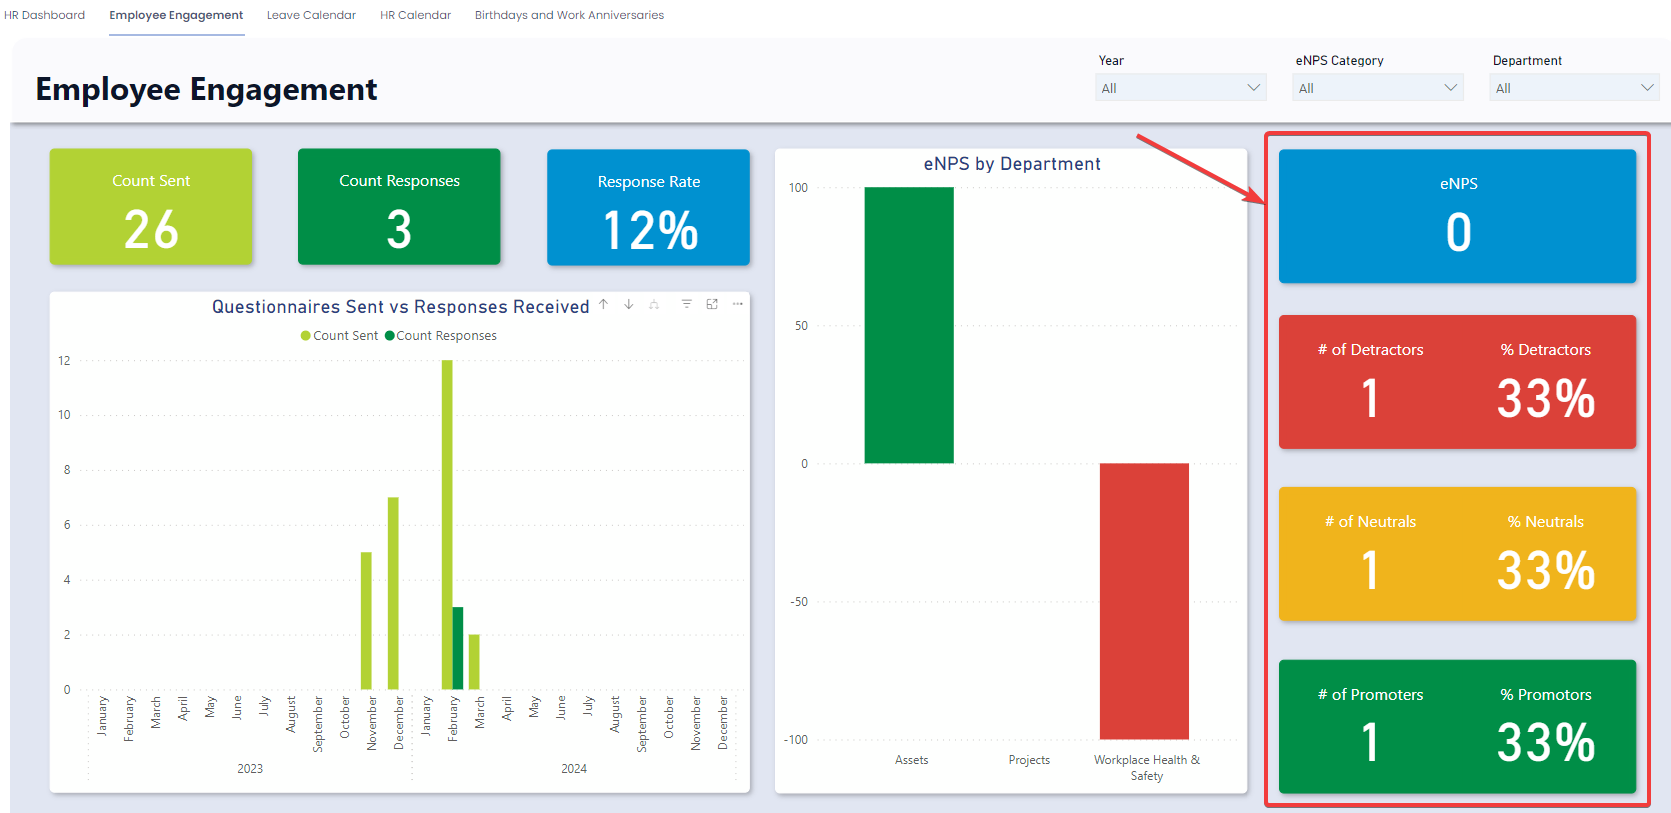
Cards
The Cards section within the eNPS by Department section offers concise reference statistics. The values of these cards will change based on the slicers. Each of these cards can be sliced by Year, and Department.
The provided cards are as follows:
- eNPS – Indicates the eNPS score which ranges from -100 (Worst) to 100 (Best). Generally, a score of 30 and above is considered good.
- # of Detractors \ % of Detractors – Represents the count of responses with a score of 6 and below. While percentage represents the percentage of responses with a score of 6 and below.
- # of Neutrals \ % of Neutrals – Represents the count of responses with a score of 7-8. While percentage represents the percentage of responses with a score of 7-8.
- # of Promotors \ % of Promotors – Represents the count of responses with a score of 9-10. While percentage represents the percentage of responses with a score of 9-10
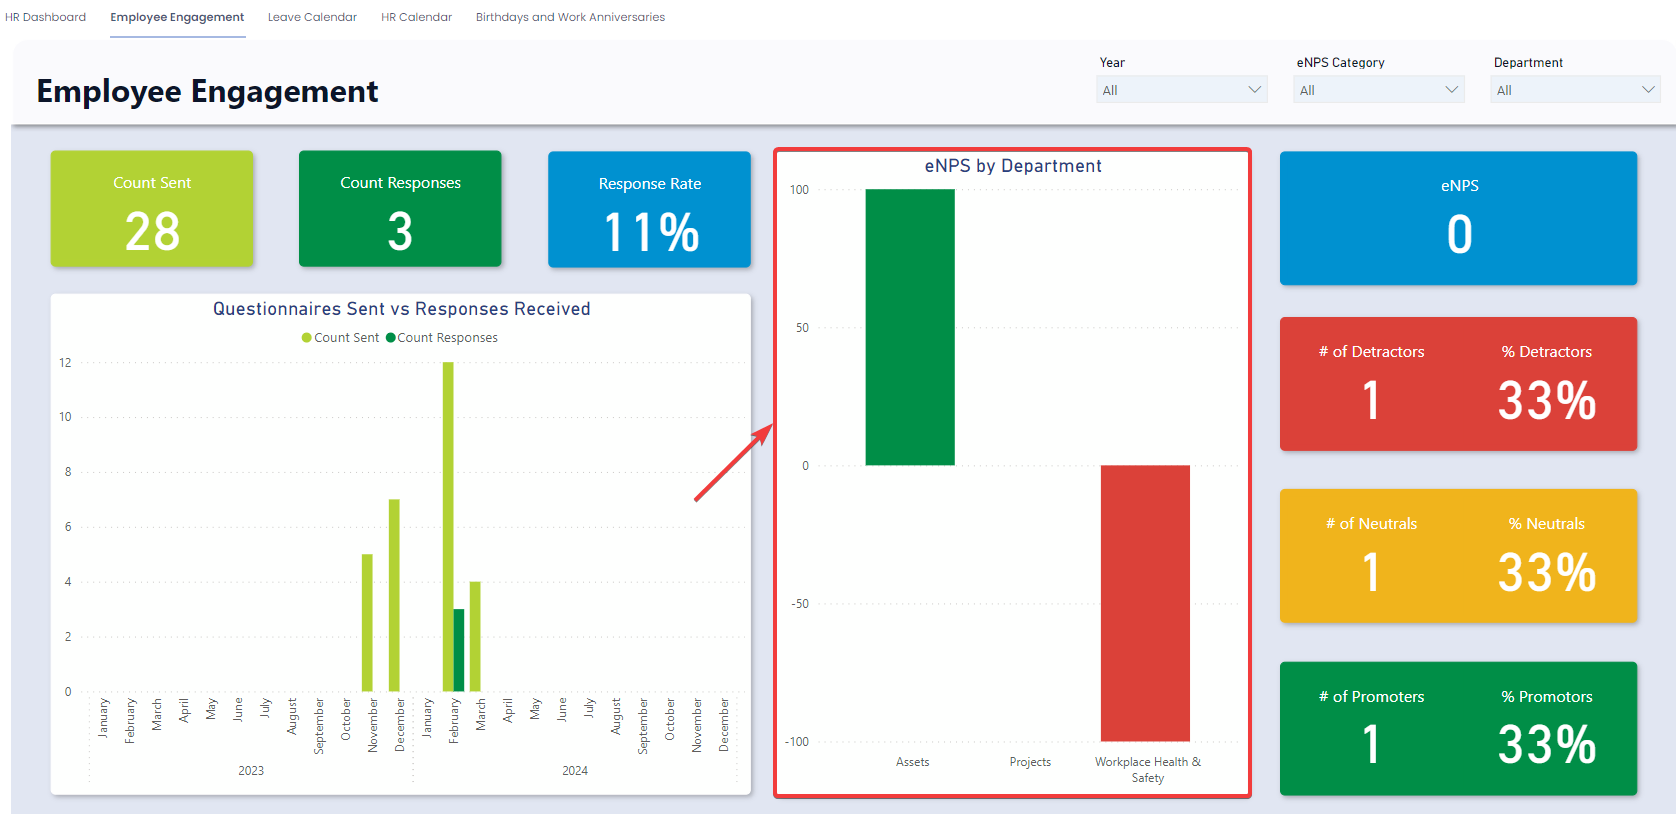
eNPS by Department Graph
The eNPS by Department Graph is a simple visual that shows the eNPS score at a department level. This can be sliced by Year, and Department.